Friday, December 31, 2010

FFIV

Duck Brother’s Investing stock pick of the week is FFIV. FFIV produces data storage devices for networking delivery. This stock has an outstanding pedigree and is forming a flat base. The buy point is $143.85 and its current price is $130.08. Over the last week volume has dried up and the 50-day moving average has caught up with the price. Watch this stock over next week for price and volume movement upward.


Since inception of this weekly stock pick Duck Brother’s is up 7.49%. LULU made us 24%, INFA has made 6.56%, and MIPS lost us 8%. PCLN and EBIX have still not made the buy point and should be watched closely for upward movement.

Monday, December 27, 2010

EBIX

This week I will be discussing EBIX. EBIX is a company that produces software for insurance companies. The company has a median price target of $25.64 and its earnings per share have steadily been growing. EBIX has a buy rating from marketgrader and is currently creating a cup with handle base. This week the pattern should fall down to the 50-day moving average where it will gain support. Once this happens if institutions are buying the company it will re-bound reaching the buy point of $24.76 with 40% or higher volume.


A recap of Duck Bother’s stock picks of the week. LULU is up 54.14%, INFA is up 9.45%, MIPS crashed -8%, BIDU and PCLN have not made the buy points. Using William J. O’Neil’s strategies we sold LULU at a 24% profit, are still holding INFA with a 9.45% profit and sold MIPS with a -8% loss. All together Duck Brothers pick of the week is up 8.46%.

Sunday, December 19, 2010

PCLN

This last week was a difficult week for Duck Brothers investing. My stock pick of the week ended in a big disappointment. MIPS hit the $16.03 buy point on Monday with increase volume, up by 148%. The stock decreased over the next three days, trending down toward the 50 day moving average. I still believe in the stock, because the fundamentals look great and it’s above the 50 day moving average. In fact the stock over last week created a cup with handle which is William J. O’Neil’s most talked about base. Continue watching this stock it’s going places.

Since the inception of this Blog Duck Brothers investing has analyzed four stocks. The stocks are LULU, INFA, BIDU, and MIPS. LULU after hitting the buy point has run up 47.02%. Implementing William J. O’Neil’s 3-to-1 sell rule we sold at a 24% profit. An example of the 3-to-1 sell rule would be selling at an 8% loss or a 24% profit. This is what we did with LULU. INFA has gone up 7.88% since the buy point. BIDU never hit the buy point and MIPS decreased 8% hitting our sell rule. So far we have picked two winners one loser and a dud.


This week we will talk about Priceline (i.e. PCLN). Priceline is an online travel agency specializing in economical tickets and packages. PCLN is making a five week flat base. Its buy point is $428.20 and its current price is $400.64.


Saturday, December 11, 2010

MIPS

Last week I talked about BIDU, China’s largest search engine. Its buy point is still $115.14. Keep this stock in your watch list and watch for volume to increase by 40% or more. I have a confession to make. This last week I bought into BIDU. When I did this I became a predictor. I thought BIDU was going up and I would get a discount price if I bought then. It still can go up, but the truth is no one knows what BIDU will do. I do not want to predict the market; I want to invest in the market. Investing is about earning money, making logical decisions, not gambling. This is a lesson learned. I still hope my gamble earns me money, but with any gamble there is more risk than there should be.

This week I will analyze MIPS. MIPS is a company that is in the semiconductor sector. More specifically they make 32-bit and 64-bit chips for computers. Currently MIPS is forming a 6 week base and its buy point is at $16.03. MIPS had its follow through day on Thursday with volume up 189.6%. This suggests institutions are buying MIPS.

Following William J O’neil’s strategy I’m up a total of 15.46% over the last month. I earned 24% on LULU and I’m up 6.94% on INFA.


Saturday, December 4, 2010

BIDU

The correction we witnessed in November was small, declining only 3.69%. Even though the correction was small and painless, I’m glad I stayed on the sidelines. This rule of thumb is the only way to prevent major losses during a large correction. During the correction leaders changed hands and stocks hit buy points, LULU and INFA to mention a few. LULU and INFA are the first two stocks I analyzed on this blog. LULU is up 14.6% and INFA moved forward 5.62%. This week I will be writing about BIDU.

BIDU is China’s largest search engine. Some people refer to it as the Google of China. Its chart is currently making what William O’Neil calls a flat base. A flat base is a second base usually forming after a cup with handle. The characteristics to look for are horizontal movement and decreasing volume. Generally it takes five to six weeks of flat sideways movement to form. Currently BIDU’s price is at $109.23 and its buy point is $115.14. Remember look for increasing volume of 40% or higher and a price increase of 2%. At this point the follow through day has arrived and institutions are buying large quantities of the stock. When you buy after the follow through day there is an 80% chance the stock will increase.

Thursday, December 2, 2010

My 'Could Have Been' Portfolio


Here is a look at what my portfolio could have been this year. This is a listing of stocks that I bought, when I bought them if I had held them until now. These buy points are from my portfolio with the actual dates, shares and prices that I invested in during 2010. Now I know that this does not really matter, but it is an interesting exercise to see where I could be if I had just held onto my winners this year.

I like this exercise because it tells me that I made some good pick, at great buy points but I didn't have the patience or discipline to hold onto them for the long haul. Dose this mean that there is a problem with my fundamental strategy, not necessarily. Does this mean that I should reconsider where I place my stop losses, probably. I think it is important to evaluate your investing strategy on a monthly basis, to see if you are making the smartest moves that you can. Although I missed out on some big gains this year by selling too early, that does not mean that I was a bad investor. It just shows me that I need to loosen the reigns on my stops and lets the winners go a little longer. Now I can adjust my strategy and move forward with confidence that I can pick good buy points.

It is also interesting to look at the chart for these 5 stocks. This is the kind of chart that all investors dream about.

Saturday, November 27, 2010

INFA

INFA is a growth stock that has gained support on its 50-day running average and had its follow through day. A follow through day is when volume is up 40% or more and the price increases at least 2% from the previous day.

Warning: In a correction investing in stocks is risky. Stocks do not follow the same patterns as a bull run. Also 3-out-4 stocks follow the general market.


Wednesday, November 24, 2010

Quick Gains


As you can see my calculated risks from the previous day paid off. It's only an hour into the market today and I made some quick gains. BIDU recovered 2.50% from yesterday and SOHU gained 2.02%. Even the markets corrected and SPY gained $1.04.

As for JKS, it corrected 1.57% as well, but I didn't have a good price when I bought yesterday so I'm still taking a light loss from my buy point. Overall I'm satisfied with the results of my spending spree yesterday. I also set my stops, but I'll explain how I got those prices in another post.

STOPS:

BIDU – 100.13

SOHU – 68.73

JKS – 24.62

SPY – 112.31

Thanksgiving Investing


It’s a few days before thanksgiving and I made a move into the stock market. I’m not sure what combination of events caused me to invest 8000 dollars into a market that is still in correction, but I saw a few things and I made some moves. In this post I’m going to show you the charts I looked at before I bought my positions and explain what I was thinking. Here is a copy of my transactions page after I bought my positions.


Now my first point is that investing into a correction is something that I’m willing to do, but it is not something that my partner Tim would recommend. The main difference is that Tim is more conservative and looks for a stock to begin rising and gets in on the way up. I’m more inclined to find a good stock at a great price and take a chance on making a bit more profit. I have said it before and I’ll say it again, we are not experts here at Duck Brothers, but we a learning as we go. We are bound to make some mistakes, but in analyzing our moves and keeping good records we can hopefully learn from our mistakes. I’m just showing you what I sometimes do when entering the market.


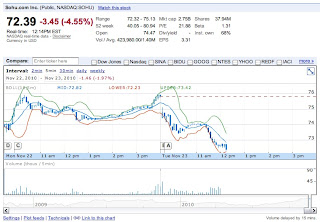
The first stock I bought was BIDU. It was a big winner for me back in July and September; and I’m up almost 15% on the year with BIDU already. I have been looking for a good time to get back into BIDU and this morning I was given a good price. The price had droppedd 3.05% in the first few hours and I thought that was about as far down as it was going to go for the day. BIDU is a good stock and is has been featured in IBD several times; I think it is in the top 5 of the IBD 100 right now. I saw this mooring’s drop as a great time to get in on an excellent stock for a discounted price. As you can see, the stock was sticking to the lower bollinger band, sometime crossing it, showing that the stock was over sold. That usually means the stock price will equalize and make a correction to the median price. Notice that this is a good move on a highly touted stock that has very little risk of taking a huge loss. No stock in the top 5 of the IBD 100 is going to loose more than 5% of it's value in a single day. I felt confident that if I did take a short term loss, it would be made up eventually with a solid company like BIDU.


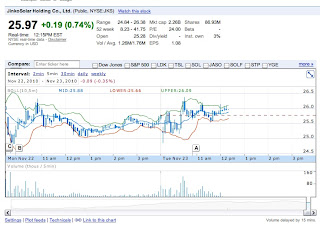
The second stock I got involved in was SOHU. It is another Chinese based Internet company. I had some good luck with SOHU earlier this year as well. Almost the same scenario as BIDU, you could say that I’m diversifying my portfolio in the Chinese Internet

sector and protecting myself from huge losses in case one of these stocks takes a dive. Again, SOHU is a solid company and I was willing to risk a short term loss to make an extra 2-3% in gains. SOHU had crossed the lower bollinger band twice and rebounded. I was pretty sure that the stock was going to stabalize around 4% lower than the opening price.


The third stock was JKS. This purchase was probably my worst decision of the morning. I had a run in with this stock earlier this month. I was scared off by the beginning of the market correction and I tightened my stop; I hit my stop loss on 11/15 and sold my 100 shares for 31.76. I had a chance at taking a 20% gain if I had sold on 11/04 but I held on and lost it all. I wanted to get back in, but I can’t justify the price I paid. Hopefully the market will turn it around and move me in the right direction.

The last, and fourth, stock I invested in today was SPY. This is an EFT based on the S&P 500 index. I like to be invested in an index EFT to balance my portfolio. I tend to invest in sectors, for example my dual investments in BIDU and SOHU. The market indexes can be a great place to park some money and just ride the market for a while. I find that the S&P 500 fits my investing philosophy a bit better than the NASDAQ. I don't have a chart for this one, but it pretty much resembles the S&P 500 on a 10% scale.

Saturday, November 20, 2010

Correction Definition

The market is considered in correction if four to seven distribution days happen within a month period. A distribution day is when one of the major indexes declines in higher volume from the previous day. When this happens you know institutions are selling more than buying. This in turn pulls the market into correction because institutions drive the stock prices up or down with their large buying capabilities.


Any of the major indexes can bring the general market into correction so watch them all and follow the distribution days. According to William O’Neil 3-out of-4 stocks follow the general market.

Thursday, November 18, 2010

Performance from 3/22-11/18/2010


Here is a nice chart from Google Finance that shows my portfolio's performance since inception in late March of this year. Although the markets bottomed out on Tuesday (when they entered correction) they have been making a nice recovery since. As you can see there are large periods of fluctuation from July through October as well as periods of stagnation in May and June when I was not invested in the market. If I had gotten out 2 weeks about I would have made 600 more, but I'm satisfied with my 2.68% return at this point.


Wednesday, November 17, 2010

Market Correction

According to my esteemed associate the market went into correction as of yesterday, 11/16. Now woould be a good time to adjust your stop loss prices to protect any gains you have made over the last few weeks/months. Market correction is something that we will be talking about a lot on this blog but all you need to know right now is that when the market goes into correction it is poised to make a drop and it is a good time to evaluate your positions and sell off any stocks that are bordering on turning a profit.

Tim and I have a little different view on how to best manage our portfolios, but that is what makes us a diversified investment analysis team. My view on market correction is that when it begins I tighten up my stops to ensure that I don't take a loss on anything. But I don't sell off my entire portfolio unless I think there is a good reason. I believe that Tim favors selling everything during a market correction, but I'll let him explain his approach in a future post. Maybe we can even get an explanation of market correction out of him. I'm not sure that either of us have it all figured out yet, but hopefully with both of us working on it we can turn a profit, or in this case prevent a loss. Happy trading!

Friday, November 12, 2010

My Story

My investing story begins shortly after I was out of high school. My father gave me a financial CD set called Automatic Millionaire by David Bach. I was enticed with stories of people investing small amounts of money each month in a 401k or IRA, and over a 30 year period becoming millionaires. Later this became reinforced by another CD set called Americas Finest Companies by Bill Staton. This set taught investing strategies in the stock market and about compounding interest. According to Bill the stock market had averaged 13% a year since 1900 and if you invested in blue chip companies you would become a millionaire. His example was invest $20 a month starting at the age of 16 and by 65 you would have one million dollars. Over that 49 year period you invested $11,760 but with compounding interest you have over $1,000,000. My question is why would you not want to learn how to invest? I started using his strategy in 2005, like everyone in 2008 I lost half my invested money. Discouraged with my investments I decided I needed to learn more. Again my father points me in the direction of a book. The title of the book is How to Make Money in Stocks by William J. O’neil. This book teaches how to read charts and what to look for in companies. William J. O’neil is the founder of Investor’s Business Daily and has made profits in good times and bad. I have been using his strategy for half a year now and have been successful. In this blog I will show my portfolio and track and my progress. I will also give a stock of the week and track the performance of those companies.

Good luck to everyone with their investments and I hope my advice comes in handy.

Tim Meyer


Tuesday, November 9, 2010

A little more history.

I just wanted to give my faithful readers a little more information about Duck Brothers and what we are doing here. My brother and I are starting an investment blog, I think that much is clear. Why we are starting the blog is the question I'm going to answer here. My name is Chuck Fletcher and I'm trading stock with my retirement savings. I don't believe that social security will still be around when I plan to retire so I'm preparing for my future by taking an active role in my retirement savings. My brother, Tim Meyer, is doing the same. I'll let Tim introduce himself soon.

We here at Duck Brothers believe in full disclosure, so I have no problems telling you how much I have invested and in what. As you can see I have already posted an image of my 4th quarter investments and what they have done for me so far. I plan on telling our readers all the moves I make in my portfolio and why I made them. This way you can see what I'm investing in, why I choose to make a trade and how that trade went. The biggest advantage to this is that you can see what I'm invested in and therefore you know I'm not just trying to hype a stock. I'm putting my own money forward to back up the articles I'm writting here. More importantly, I'm entrusting my retirement to this process. I'm sure I will make mistakes, but I think there will be some sucesses as well.

My investments are made entirely in a traditional IRA at Charles Schwab. The advantage of investing in stocks with an IRA is that I don't pay capital gains tax when I buy and sell. I'll pay all of my taxes when I withdraw the money in 2045. The funds I have invested here are from a previous 401K that I funded from 2004-2006. The 401K was doing great for me until the market crash in 2008 and I lost almost half the value of my retirement investments. That's when I decided to take matters into my own hands and seize control of my retirement and I began trading in stocks rather than mutual funds. I also am beginning to trade with stop loss orders to prevent EVER loosing 50% of my investments again.

Portfolio this morning.

Here is what 4th quarter is looking like for me so far. Click on the image for an enlarged view.


Here is what my 2010 portfolio looks like this morning on google finance. For some reason this one won't enlarge. I'm working on a hot fix.


Monday, November 8, 2010

Welcome to Duck Brothers

This is an investment blog created by two bothers who know very little about investing. But we are learning and we want to take you along on our journey. Both Tim and I are investing with around 10,000 dollars in retirement money, but there will be time to discuss that later. Anyway, check back a few times a week to see how we are doing. Maybe we will make some money together. --Chuck